Description
To construct the OGUROB DOORS dataset, Gazebo simulation environment and ROS robot interface are used. First, we selected the minimum and maximum distance between robot and door frame as 1.5 and 3.5 meters, respectively. Then, we positioned the robot in uniformly distributed locations with a 10 cm interval in each dimension. The orientation of the robot was determined randomly. For each robot location, we captured point cloud data for open, semi-opened, and closed doors. As a result, we obtained 1353 samples for each type of door. Then, we separated the samples depending on the distance between the robot and the door frame into four equal parts with a step size of 0.5 meters. Besides, we categorized the samples into five regions according to the angle between the robot and the door frame. Figure 1 shows the position of the door frame and robot locations with a large black circle and small filled circles, respectively.
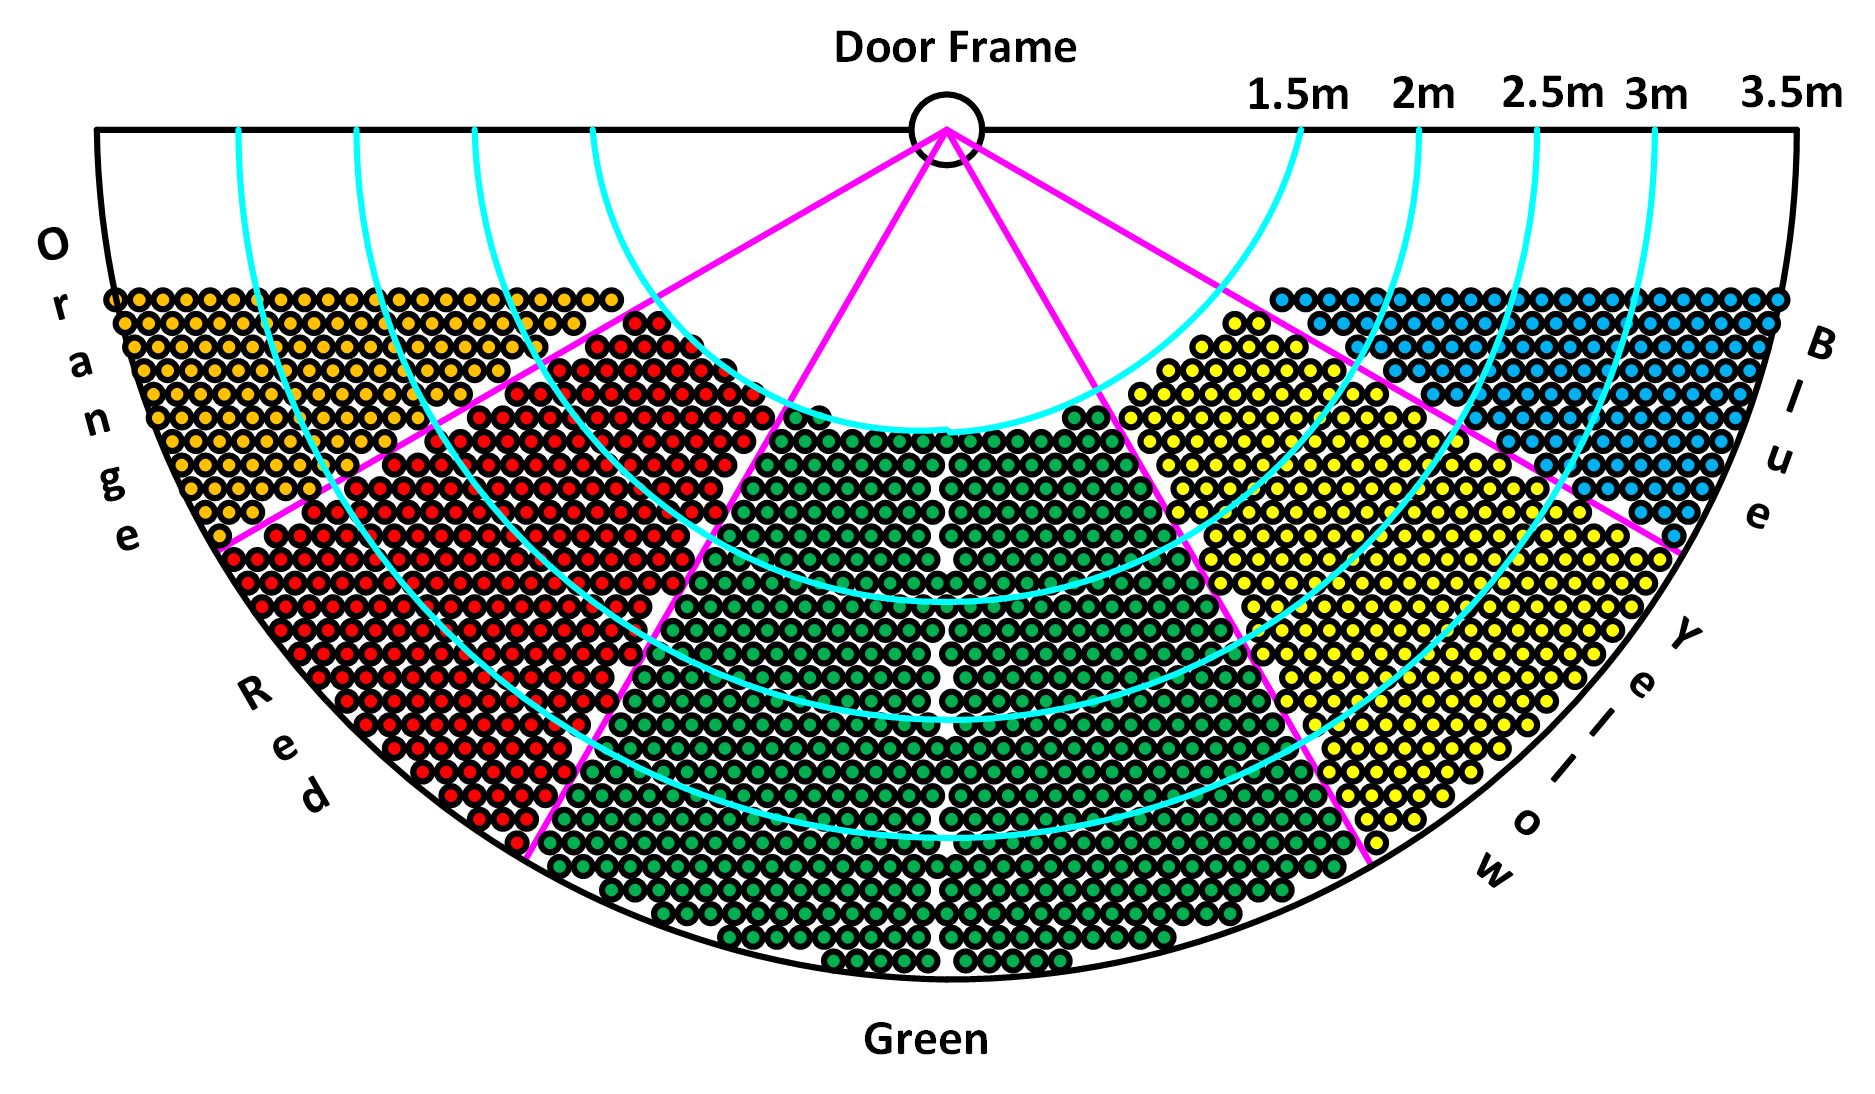
Figure 1. Robot locations. Orange (00 - 300), Red (300 - 600), Green (600 - 1200), Yellow (1200 - 1500), and Blue (1500 - 1800)
In the figure, cyan semi-circles depict boundaries of the parts according to distance. Also, pink line segments separate regions depending on the angle. In orange and blue regions, the angle between robot and door frame varies from 00 to 300 and from 1500 to 1800, respectively. The angle alters from 300 to 600 and from 1200 to 1500, respectively, in red and yellow regions. Lastly, in the green region, the angle changes between 600 and 1200. Table shows the number of samples depending on angle and distance between robot and door frame.
Number of samples depending on angle and distance
|
Dist
Angle |
1.5-2m |
2-2.5m |
2.5-3m |
3-3.5m |
Total |
|
Orange |
9 |
21 |
41 |
59 |
130 |
|
Red |
50 |
55 |
70 |
91 |
266 |
|
Green |
117 |
115 |
140 |
189 |
561 |
|
Yellow |
50 |
55 |
70 |
91 |
266 |
|
Blue |
9 |
21 |
41 |
59 |
130 |
|
Total |
235 |
267 |
362 |
489 |
1353 |
Figure 2 indicates samples for open, semi-opened, and closed doors belong to orange, red, green, yellow, and blue regions with different distances. In the figure, the first two columns indicate examples of open doors. RGB image and point cloud data of the corresponding scene are given in the first and second columns, respectively. Similarly, the third and fourth columns depict examples of semi-opened doors, and the last two columns show closed-doors examples.
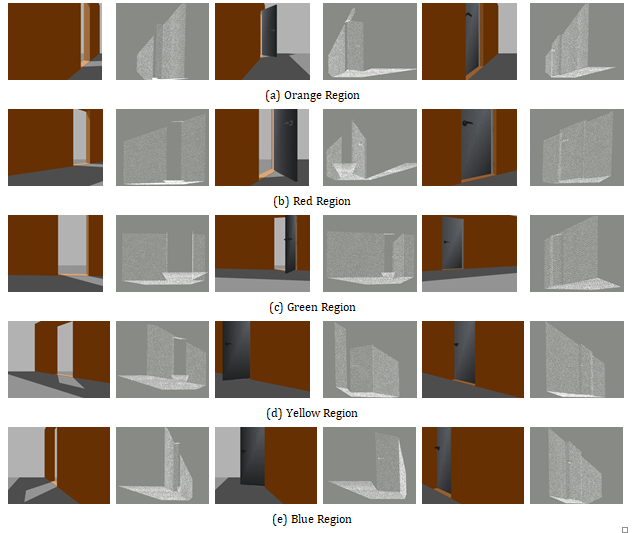
Figure 2. Samples for open, semi-opened, and closed doors belong to orange, red, green, yellow, and blue regions with different distances. The first column indicates RGB image of open doors. The second column is point cloud data of the corresponding scene. The third column indicates RGB image of semi-opened doors. The fourth column is point cloud data of the corresponding scene. The fifth column indicates RGB image of closed doors. The sixth column is point cloud data of the corresponding scene.
Download
You can download OGUROB DOORS dataset.